Projects
{webpea}
R package, experimental

Enables R users to easily export / save plots in the WebP image file format.
Key features:
- Output plots as WebP
- Significant file size reduction
- Use as drop-in replacement for {ggplot}’s ggsave()
{namedropR}
R package, available on CRAN
Enables R users to convert a bibliography into a collection of legible, well formatted banners to cite scientific literature on conference slides and posters.
Key features:
- Output as PNG or HTML object
- QR code to make citation scannable
- Predefined styles and individual adjustments
30 Day Chart Challenge
2022 edition
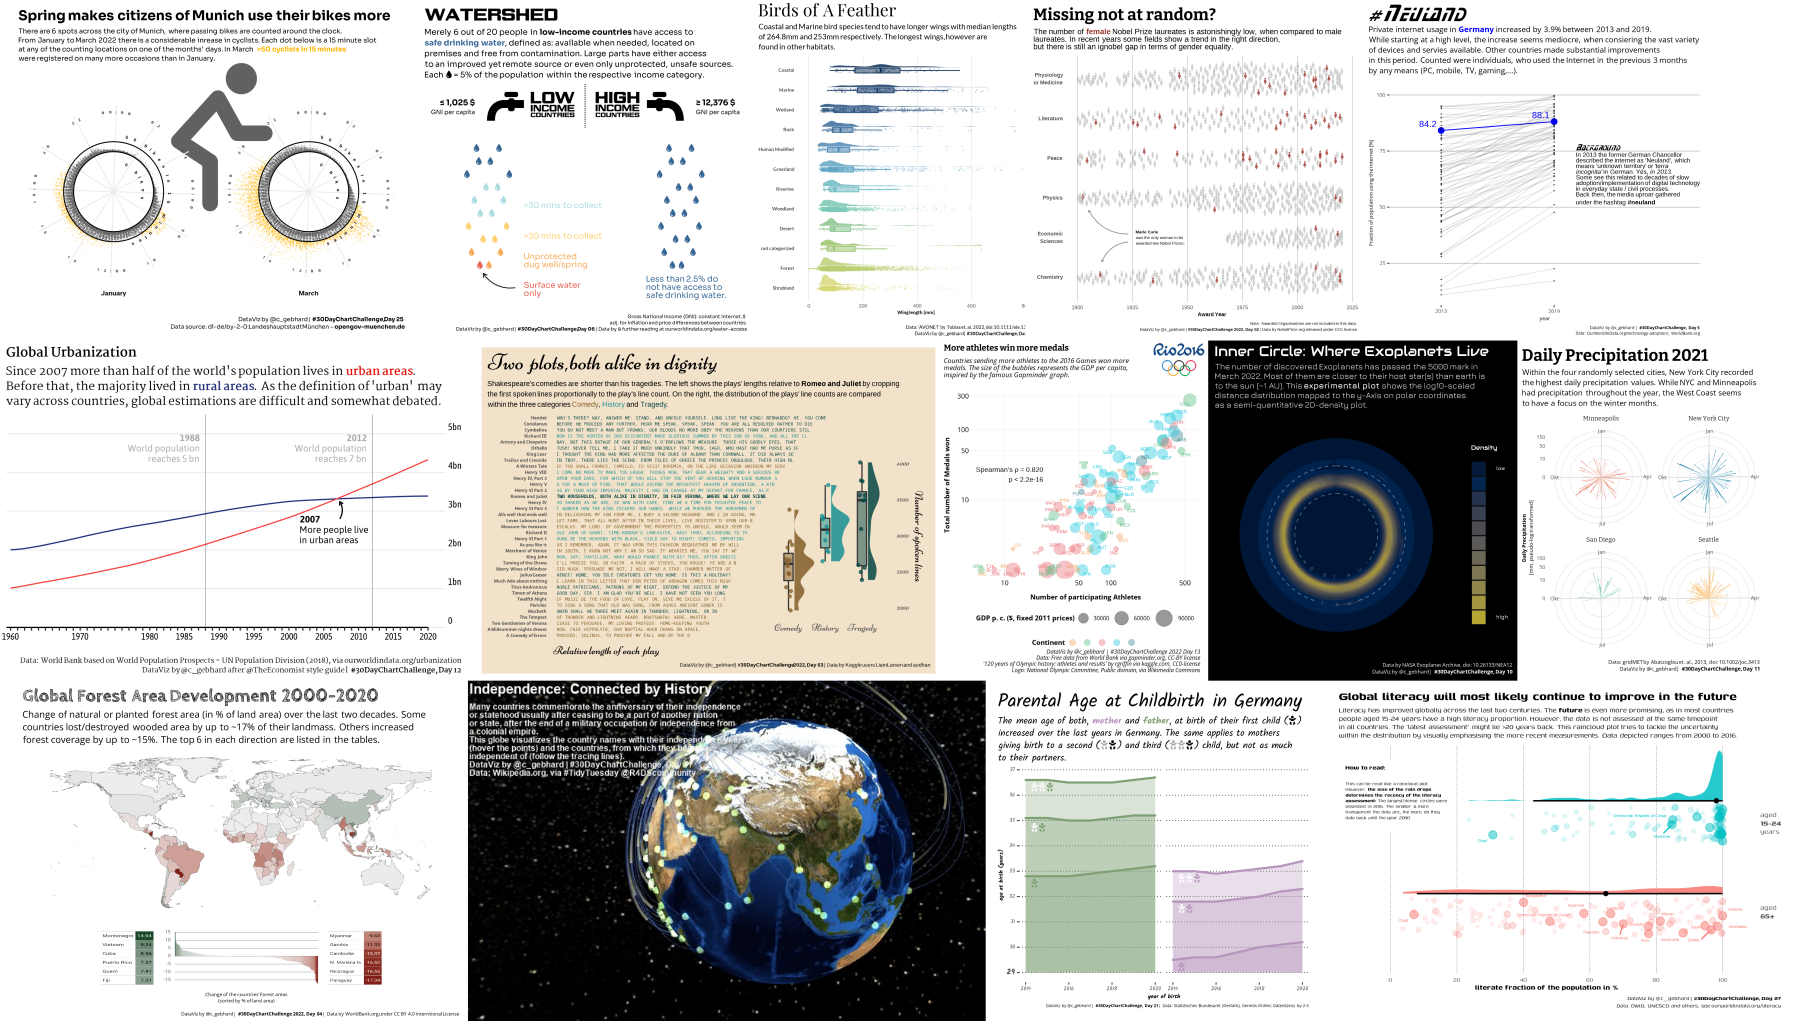
A data visualization community-challenge. Each day in April has a new prompt for a visualization from five different categories: Comparisons, Distributions, Relationships, Timeseries, Uncertainties.
I contributed 20 visualizations, learned new technologies and enjoyed the great contributions of the many other participants.
Bundestag-Series
A collection of posts analysing open data of the German National Parliament
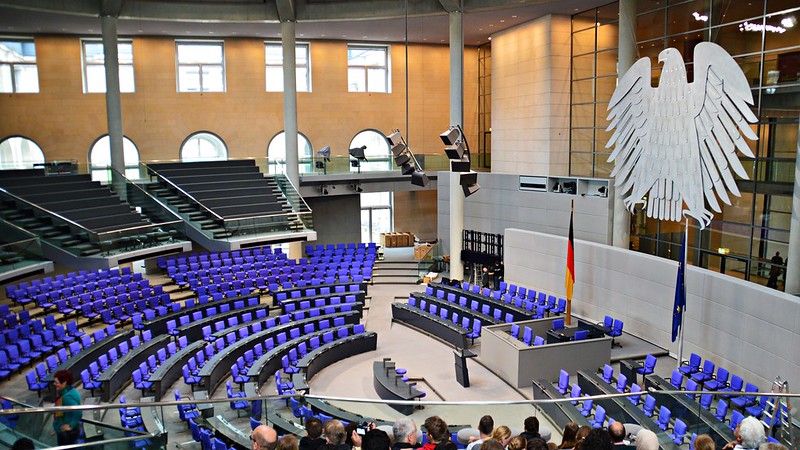
The German National Parliament, the “Bundestag”, provides open datasets, that contain information on elected representatives over time and data on public votes.
In this series I analyse several aspects of the Bundestag, ranging from age and gender distribution over the decades to a network analysis of parliamentarians according to their voting behavior.